
Reposted from the Economic Policy Institute blog
*******
China responsible for bulk of the U.S. trade deficit in non-oil manufactured goods
Robert E. Scott | February 13, 2012 | Economic Policy Institute blog
The U.S. Census Bureau recently reported that the U.S. goods trade deficit increased from $645.9 billion to $737.1 billion in 2011 (an increase of $91.2 billion, or 14.1 percent). Crude and refined petroleum products were responsible for $61.3 billion, or 67.2 percent of the increase in the total goods trade deficit, as reported by the Census Bureau. The U.S. trade deficit in non-oil manufactured goods increased by $48.9 billion, or more than the residual.¹ The U.S. has a small, growing trade surplus in agricultural goods which increased from $36.2 billion in 2010 to $43.1 billion in 2011. We are, in effect, trading energy and capital intensive cash grains and other farm products for labor intensive manufactured goods.
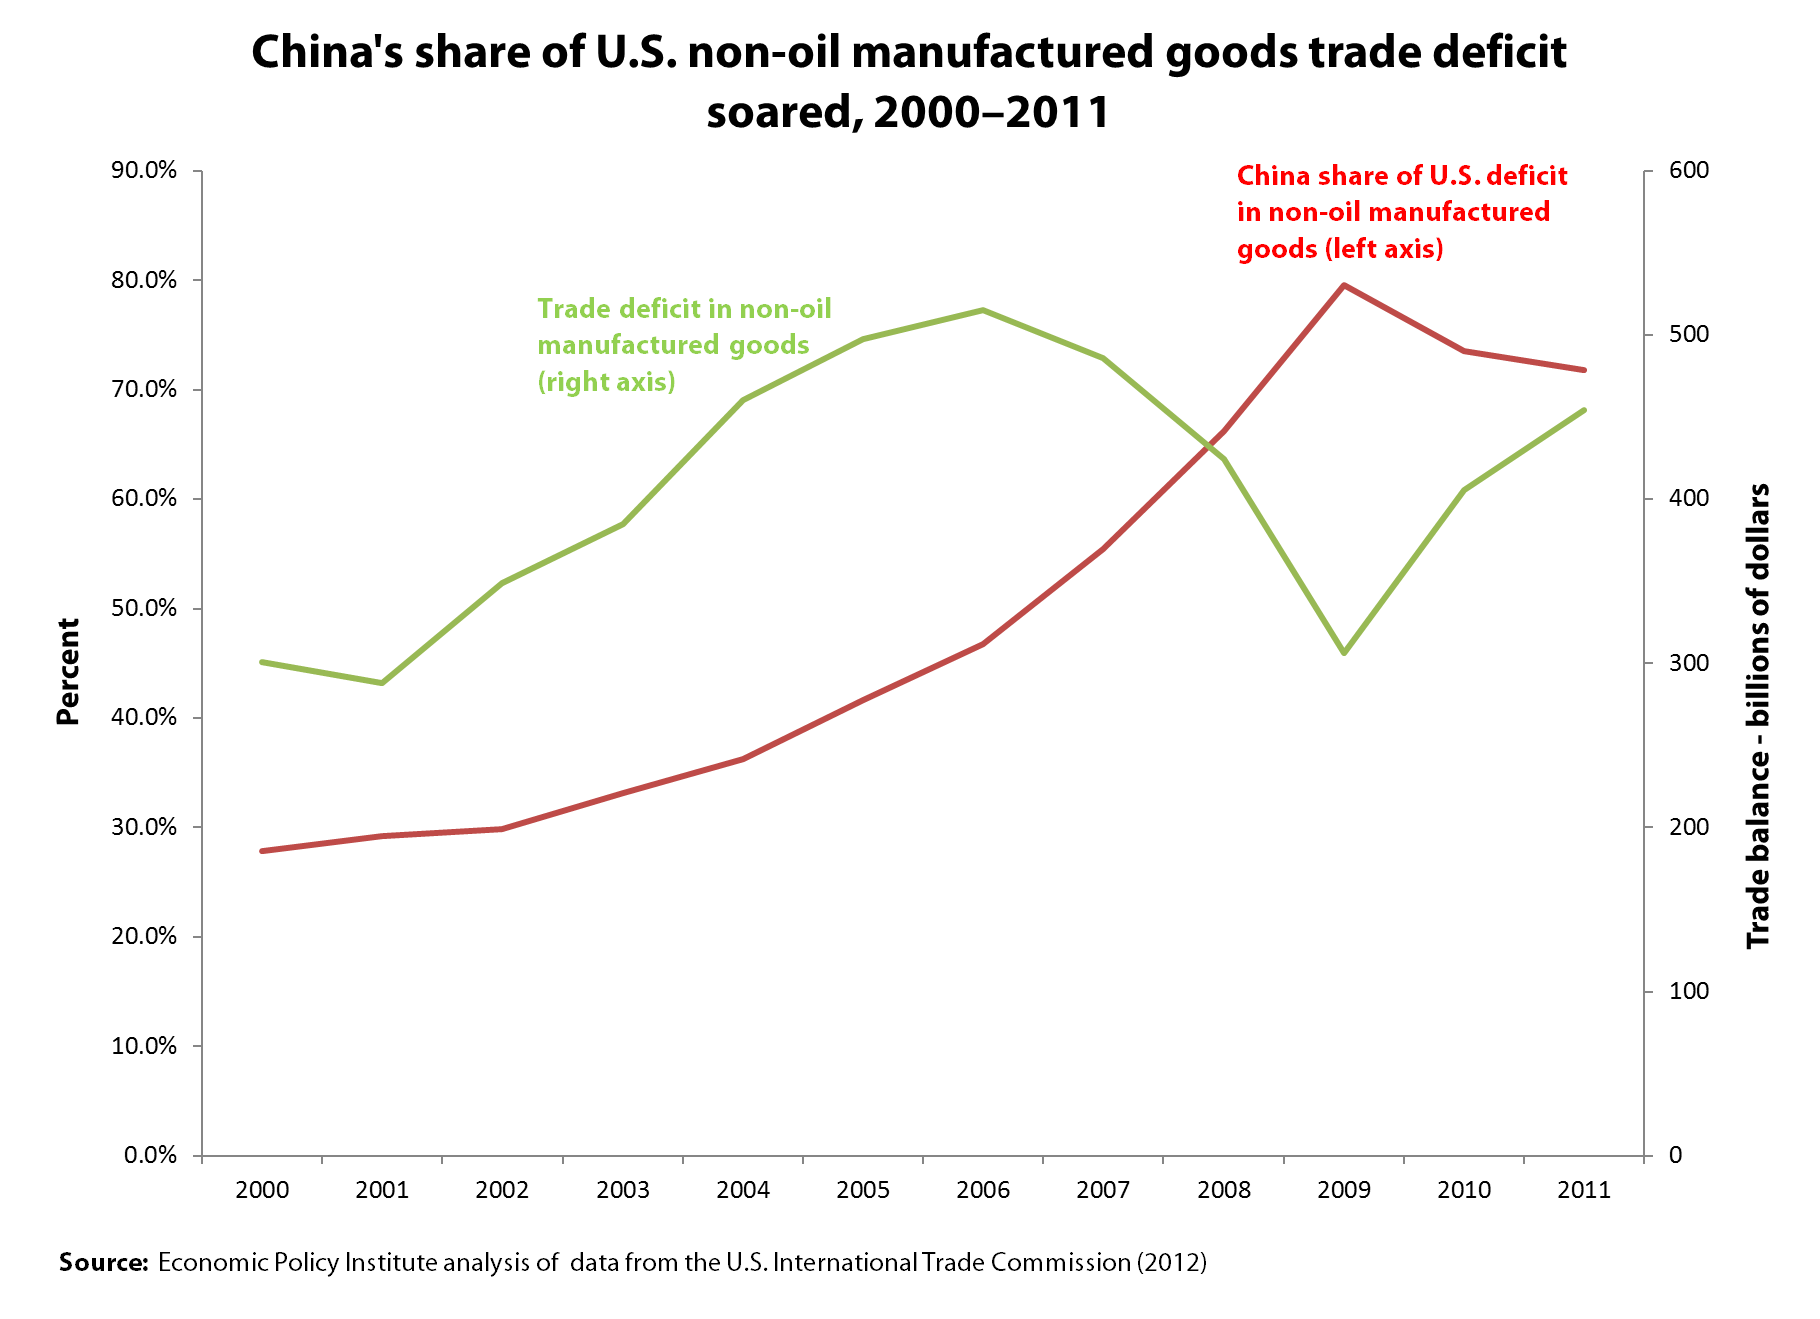
The U.S. has a large and rapidly growing trade deficit in non-oil manufactured goods, as shown in the figure below. This deficit reached a peak of $515 billion in 2006 (shown on the right axis), improved slightly in 2007 and then collapsed during the recession in 2008 and 2009 as employment, consumer incomes and demand for manufactured goods—especially durable products like automobiles—fell sharply. As a result, imports and the non-oil manufacturing trade deficit also declined in the same period.
 The U.S. trade deficit in non-oil manufactured goods has been growing rapidly since 2009, as shown in the figure, which has contributed to the slow growth of manufacturing employment since the Great Recession. The U.S. lost 2.3 million manufacturing jobs between Dec. 2007 and the employment trough in Jan. 2010. Only 354,000 manufacturing jobs were added through Dec. 2011, an increase of 3.1 percent (BLS 2012). Manufacturing output, on the other hand, which reached its nadir earlier, in June 2009, has recovered much more strongly, up 16.0 percent since the trough. The difference is due, in part, to the rapid growth of the manufacturing trade deficit shown in the figure.
Throughout this period, imports of manufactured goods from China have continued to grow rapidly. Their share of the U.S. non-oil trade deficit in manufactured goods trade deficit rose steadily and more than tripled between 2000 and 2009 as shown on the red line in the figure (measured on the left axis). The U.S. trade deficit with China in these products increased in every year between 2000 and 2008. They fell only briefly in 2009, and hit new, record levels each year in 2010 and 2011, peaking at $326.1 billion in 2011. The U.S. trade deficit with China in non-oil manufactured products exceeded the overall bilateral deficit because the United States had a small trade surplus with China in raw agricultural products.²
Although China’s share of the manufacturing trade deficit has declined slightly in the past two years, as shown in the figure, China and five other Asian trading partners have been responsible for 80 percent or more of the U.S. trade deficit in non-oil manufactured products for the past three years. These trading partners are South Korea, Hong Kong, Taiwan, Indonesia and Malaysia. These countries have been forced to manipulate their currencies and compete with China on unfair trade practices to avoid loss of market share and falling behind.
Each of these countries has engaged in substantial currency manipulation and four of the six (China, Hong Kong, Taiwan, and Malaysia) have been identified as maintaining heavily undervalued currencies, relative to the dollar. The share of these six countries in the U.S. manufacturing trade deficits ranged from 92.4 percent in 2009 to 81.0 percent in 2011.
What China has in common with most, if not all, of its Asian trading partners are a set of illegal trade practices including currency manipulation and subsidies and other markets barriers. As noted by the Alliance for American Manufacturing’s Scott Paul, China’s unfair trade policies “are now the single largest impediment to job growth in America.” It is time for the United States to get tough with China and other unfair traders and put an end to these policies. The first and most important step is to get tough with currency manipulators.
¹Detailed data on product and industry trade by country in this post were all based on EPI analysis of data from the U.S. International Trade Commission (2012).
²Note, however, that China has sustained a small trade surplus in processed food and beverage products with the United States for the past four years; this surplus was $386 million in 2011 (U.S. International Trade Commission 2012).
References
U.S. International Trade Commission (U.S.I.T.C.). 2012. USITC Interactive Tariff and Trade DataWeb. Washington, D.C.: U.S.I.T.C. Available at: http://dataweb.usitc.gov/scripts/user_set.asp (registration required). Accessed December 9, 2012.
